
I’ve always been fascinated by the concept of a runner’s journey.
I’m a big fan of George Sheehan. I’d highly recommend his book Running & Being. One of his most famous quotes is:
We are each an experiment of one.George Sheehan
And so I’ve thought a lot about where we begin, where we progress to, and the question of whether we’ve ever reached our individual potential.
No matter where or when we start – that first line in the sand, as I like to think of it – we have a journey of progress and improvement to follow.
My line in the sand
Take me as an example.
I like to park my running exploits as a child to one side. My real running journey, like so many others, started the first time I laced up my Pumas and went to Newcastle parkrun back in 2012 as a 31-year-old.
I gave it everything that day. I literally hobbled home. My calves were cramping badly. I don’t think I had any more to give. I managed a time of 22:39. Unbeknownst to me at the time, that represented an age grade of 57.1% by parkrun’s tables (56.7% on the Arc’s 2025 tables) and a VDOT (based on the Jack Daniels formula) of 43.0.
Fast forward to 2021 – about nine years of training later – and I was able to run 16:01 over 5km as a 40-year-old. That was more like 84.5% age grade and 64.5 VDOT.
I regard this as the peak of my powers so far…
Runner’s Arc
As I write this, another five years down the line, I’ve begun to finally crystallise all the thoughts and ideas I’ve had around running journeys, running potential, and the impact of time and ageing.
What has emerged is what I am calling Runner’s Arc. And I’d like you to try it for yourself.
Although anyone can use it, no matter what stage of the running journey they are at, I think it is designed with more experienced runners in mind – and perhaps even more so runners entering or in the masters category.
The Arc works best if you have a clear idea of what that first line in the sand was. Maybe it was your first parkrun (like me), or maybe it was your first race proper – whatever the distance. The tool handles distances from the mile up to the marathon, and is designed for road running.
It is a quick process to enter your first effort, then your lifetime bests. It’s also useful to enter some recent performances from the last six months. Finally, you have the option to enter a goal race and time.
The Arc then plots your journey on both age grade and VDOT. You can see where you started and where you got to, and how your recent fitness stacks up. All of your lifetime bests are graded, and the journey to your goal race is extrapolated forwards.
The Arc assesses your goal race and time and proposes the steps to get there. In essence, it helps you consider your goals in the context of your whole running journey.
My Arc
Below is my Runner’s Arc, from that 22:39 line in the sand in 2012 to the 16:01 5km in 2021.
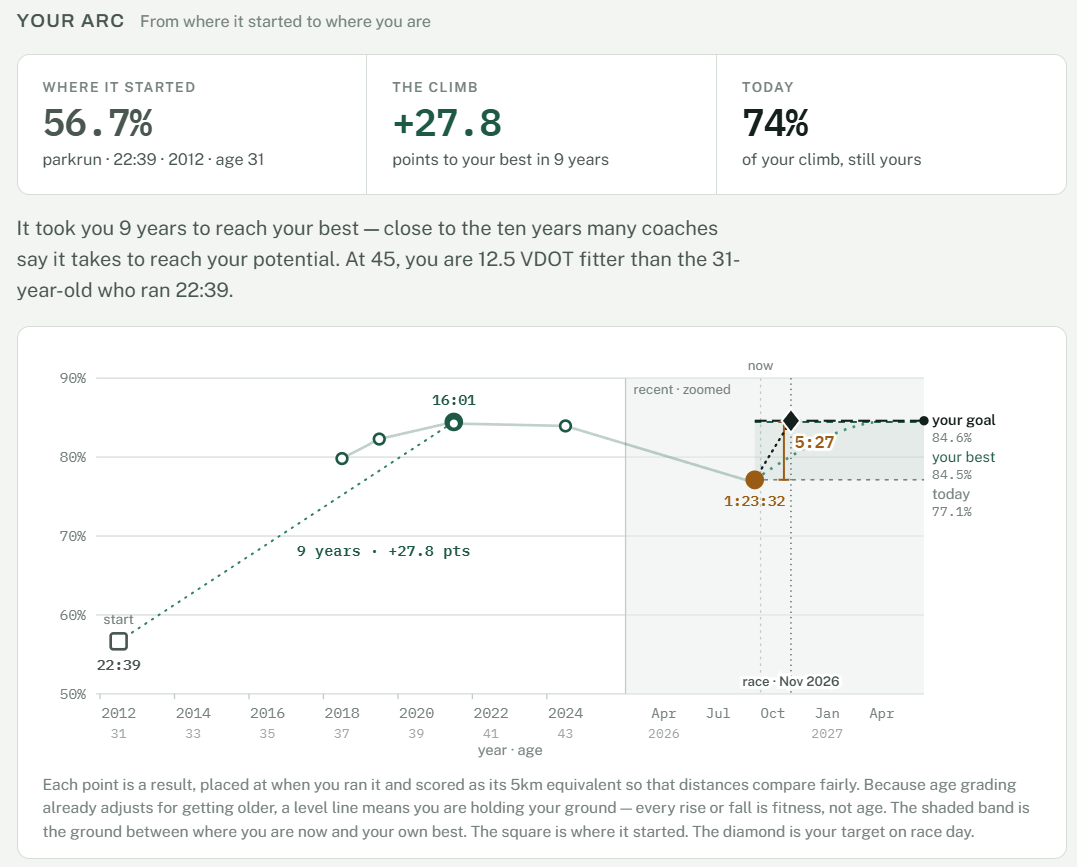
My current goal is to compete as a 45-year-old at the iconic Brampton to Carlisle 10 miler in November 2026.
As the Arc shows, my 10-mile personal best from 2019 is not as strong as my 16:01 5km in age-grade terms.
It also shows that my most recent race, 1:23:32 at the Great North Run half marathon, is a fair way below the level my goal time for Brampton needs.
I entered a goal time of 57:00, thinking that would be realistic given I ran 55:37 in 2019. But this hits on a key issue: as we age as runners, time almost becomes a false proxy. We are too focused on time. My ego was very close to entering 55:37 as the goal.
The issue, of course, is that seven years have passed since that 55:37. And five years have passed since the 16:01 5km.
Age or fitness?
But I have built the Arc with positivity in mind. The tool is clear: 57:06 is possible at 45 if I can run to the level of my best.
At least 59%, and most likely 69%, of the gap is within reach.
Since your best you have dropped 8.9 VDOT. Age accounts for 1.9–3.6 of that (most likely 2.8) – the cost of 5 more years, depending on how kindly they treat you. The other 5.3–7.1 is fitness, and fitness can be rebuilt. In 10-mile terms, age has cost you 1:24–2:50 and fitness 4:44–6:10.
Your best, carried to 45, is 57:06 for 10 miles on the tables – anywhere from 56:23 if the years have been kind to you to 57:49 if they have not.
Stepping stones
What happens on the day will depend, of course, on the training you are able to complete in the lead-up. And again, the Arc can help with a view on stepping stones:
| When | On track if you run | |
|---|---|---|
| Now | 18:13 parkruntoday’s level | 77.1% |
| Early Oct | 17:22 parkrun | 80.9% |
| About 3 weeks out · late Oct | 34:27 10km, or 16:36 parkrungreen light | 84.6% |
As this shows, to have a great chance of 57:00 I’d need to lift my current level of around 18:13 for 5km to about 16:36, or 34:27 for 10km. The 10km is the better guide for 10 miles.
We can see clearly that my goal of 57:00 is a big stretch.
The tool is flexible, so you can easily go back to the inputs and play around with goal times to re-plot the Arc.
Where my bests sit
The Arc has a number of other views that give perspective on the journey so far and the potential to come. In particular, I like this chart, which neatly shows where my lifetime bests sit alongside each other:
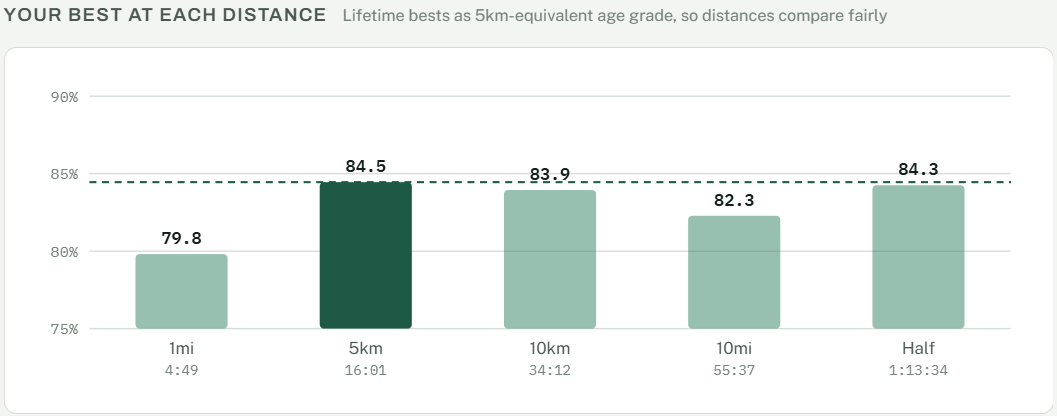
The chart clearly shows I have untapped potential in the mile in particular – and maybe also the 10 miles I am targeting next.
So what does all this mean?
I am taking it to mean that the November 10 miler will be a stepping stone on my training journey through winter 2026/27. With about six or seven weeks to go until race day, a more realistic target could be 58:49, as shown in “The way to your goal” table:
| Level | Time at 45 | From today | |
|---|---|---|---|
| Today | 1:02:33 | – | 77.1% |
| Stepping stone | 1:00:17 | −2:16 | 80% |
| Stepping stone | 58:49 | −3:44 | 82% |
| Your best level | 57:06 | −5:27 | 84.5% |
| Your goal | 57:00 | −5:33 | 84.6% |
| Beyond your goal | 56:04 | −6:29 | 86% |
I’ll be sharing each step from here to November. Follow me for regular updates on KR Runs YouTube.
Now it’s your turn
Find your line in the sand, add your bests, and plot your own Arc. It takes five minutes, it’s free, and you can have your Arc emailed to you so you can come back to it as your own journey unfolds.
Plot your Arc I’d love to hear your feedback